WebGL 3D Plotting tool
I did this for the sole purpose of learning and practice three.js ages ago, there are far better and more complete solutions out there (https://plot.ly/python/3d-scatter-plots/), don't even try to use this. The code quality and everything is, due to me not having any experience back then, probably really bad.
Plots Functions, .CSV Data and Dataframes into a WebGL 3D space using three.js.
Features
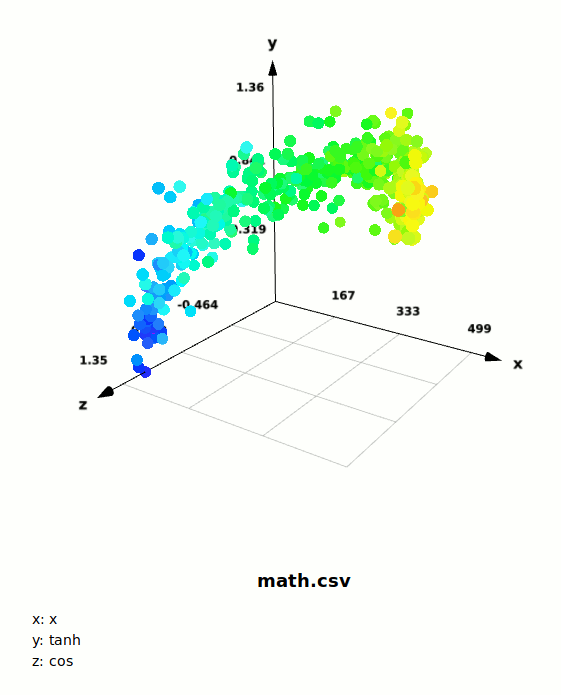
- scatterplots
- coloring labels
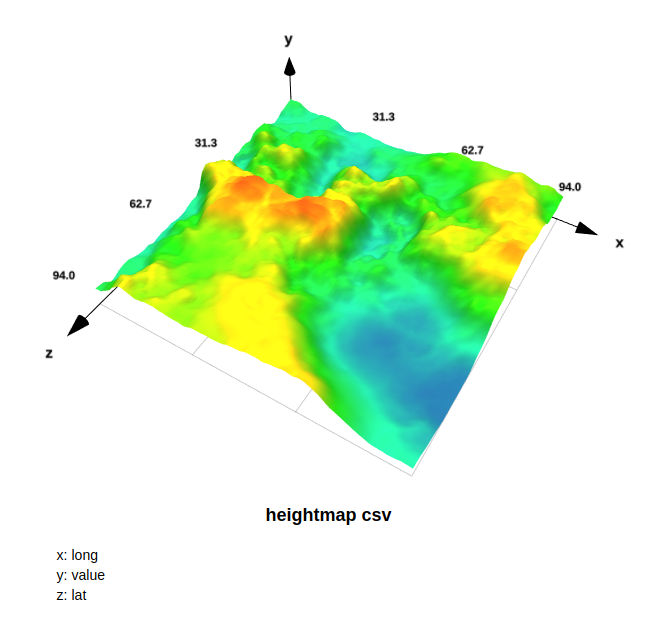
- heatmap colored datapoints
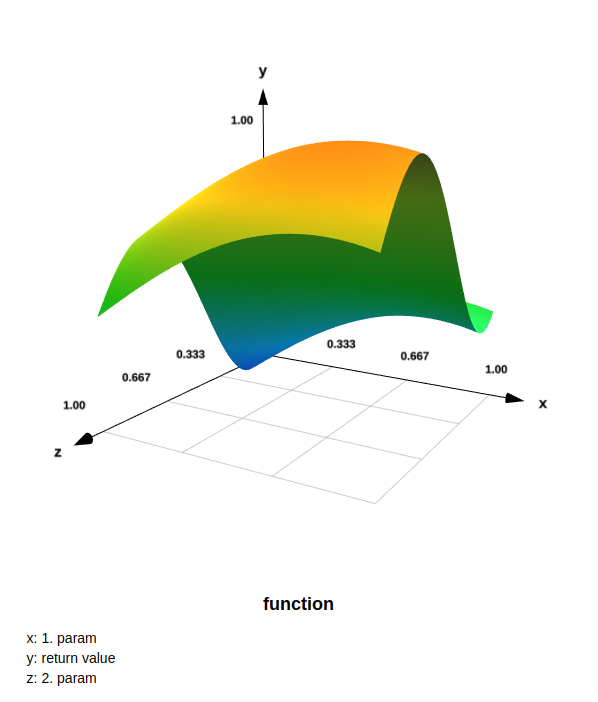
- validates and plots formulas
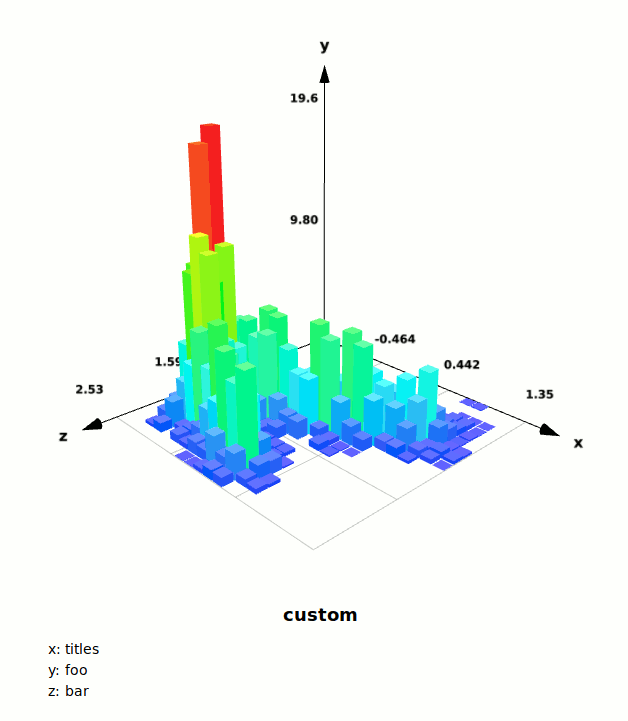
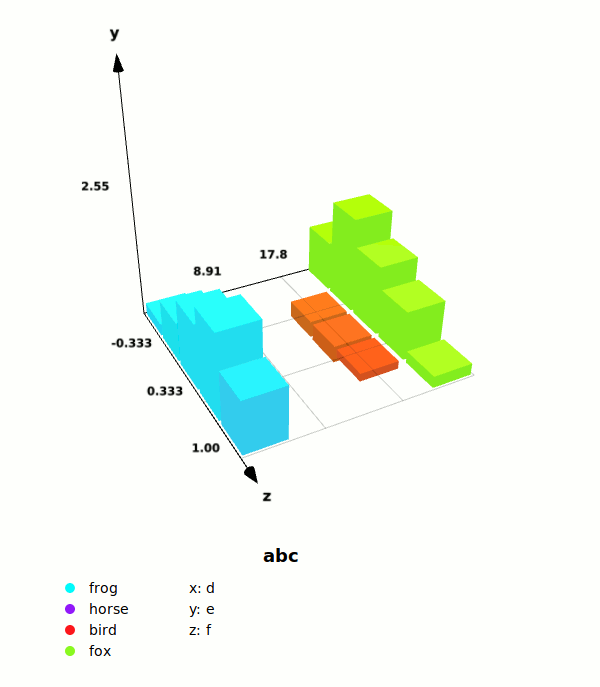
- barcharts
- placing autogenerated legends into the DOM
- optimized for adding/replacing datapoints quickly during runtime
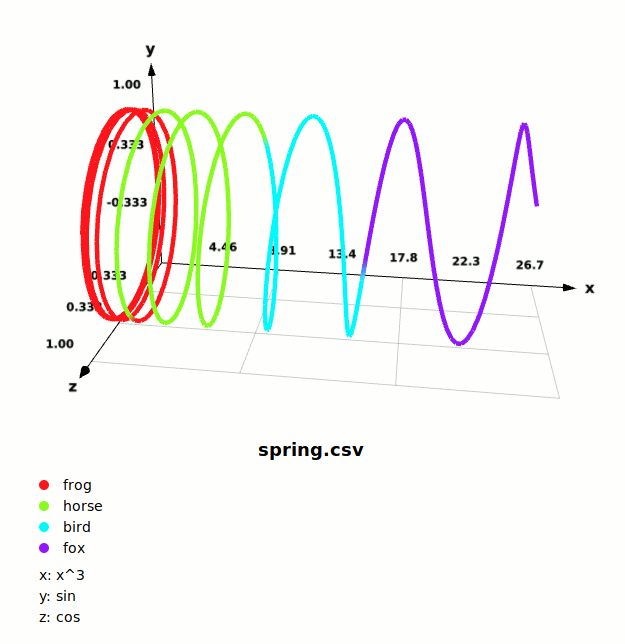
- reads .csv files
- lineplots
- 2D view
- drawing polygons from dataframes
Links
More information on GitHub: https://github.com/sezanzeb/JsPlot3D
Live example: http://hip70890b.de/JsPlot3D/examples/playground/index.html
Download: http://hip70890b.de/JsPlot3D/compiled/JsPlot3D.js
Released under the Unlicense (public domain)